HIPAA breach & home health agency exposure.
Three interactive maps exploring the spatial relationship between breach activity and home health agency density across the United States. All data drawn from federal sources; all code and methodology are open.
The Figures
The Maps
Threat
Every HIPAA breach affecting 500+ people, 2015–2026. Toggle among density hexagons, typed scatter points, and heat.
Exposure
Every Medicare-certified home health agency, colored by ownership type. For-profit dominance visible at a glance; zoom into any metro area.
Overlay
Breach heat layered on agency density. Toggle layers to see the correlation — where the industry grows, the breaches follow.
Findings
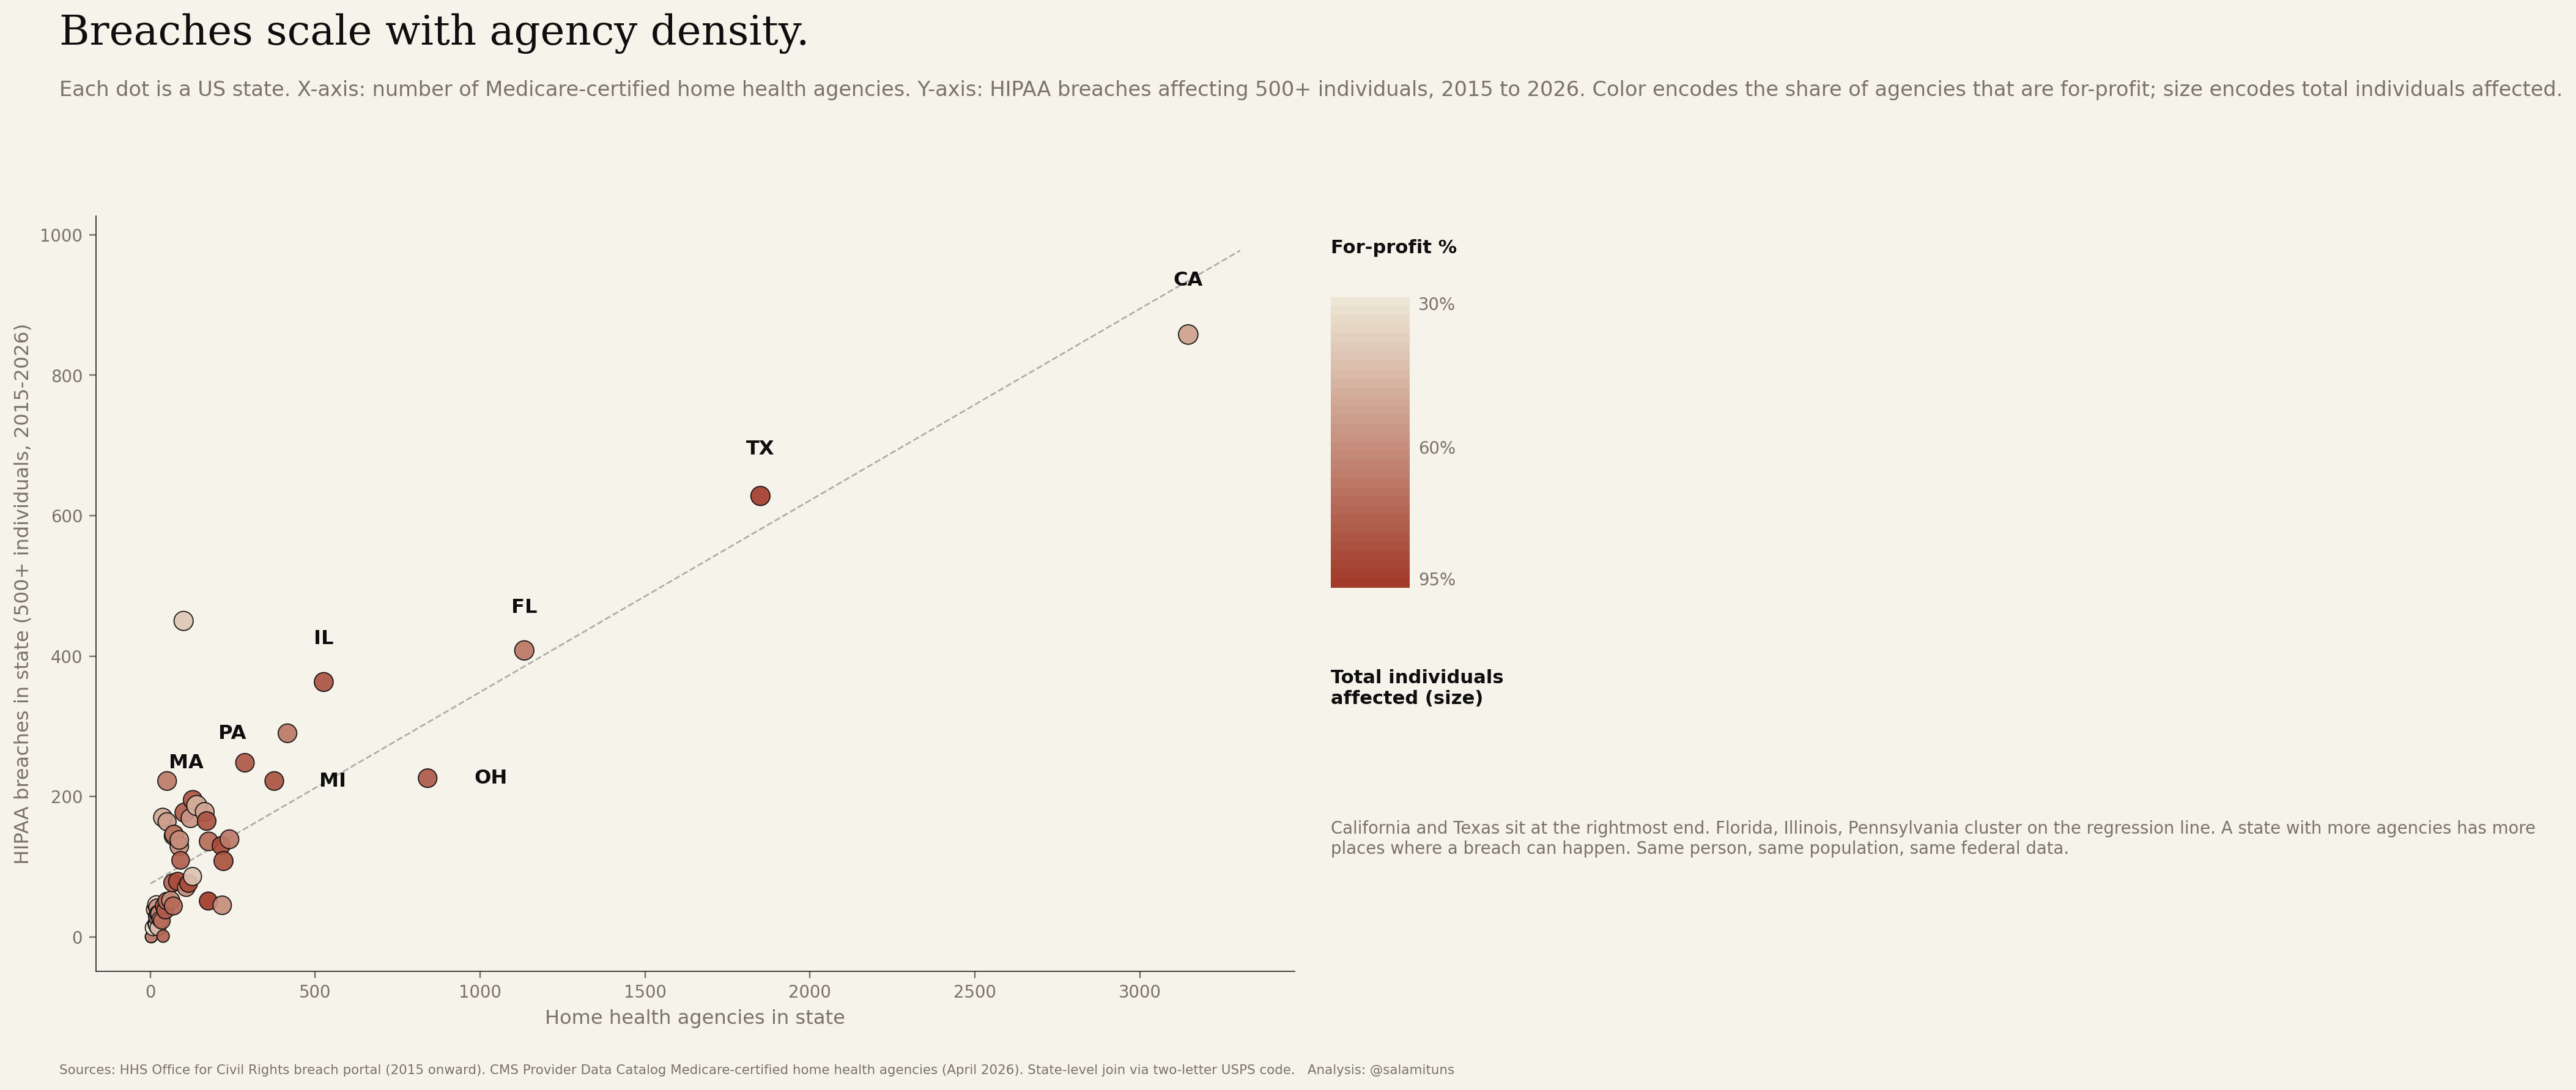
Breaches scale with agency density.
Plot every state's home health agency count against its HIPAA breach count. The relationship is close to linear. California and Texas are the rightmost outliers; the mid-range cluster (Florida, Illinois, Pennsylvania) sits exactly where regression would put them.
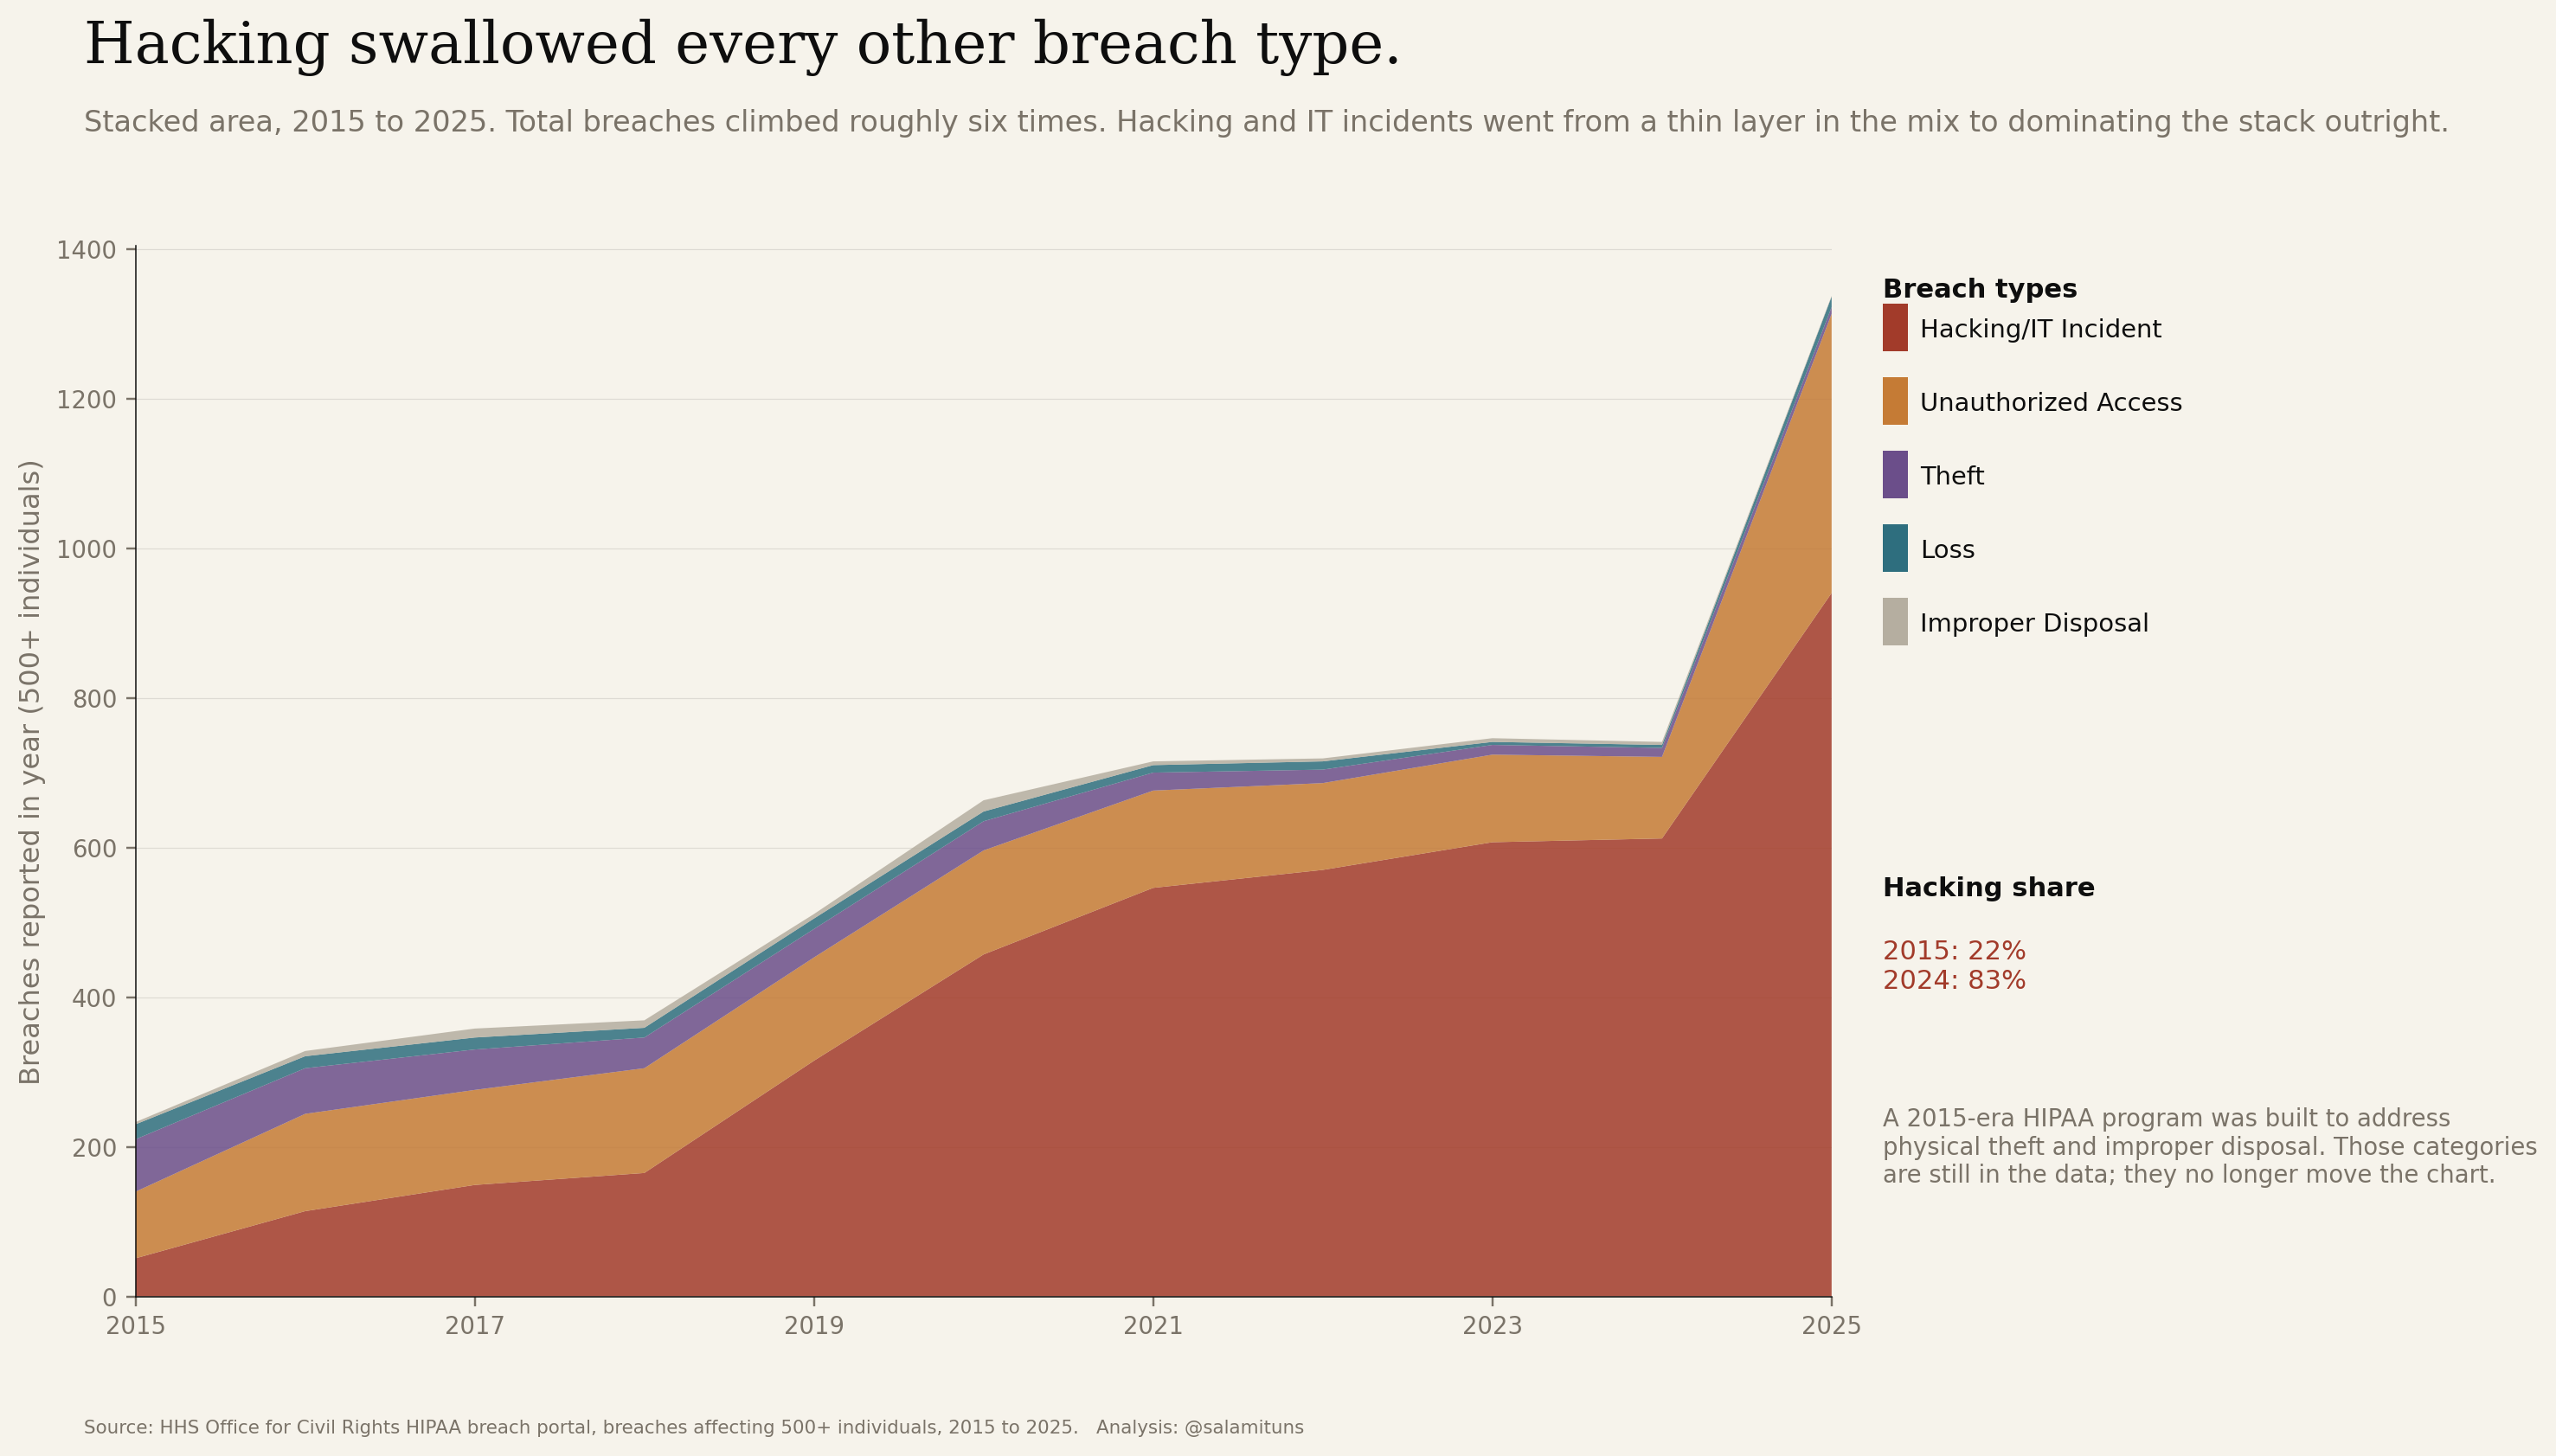
Hacking swallowed every other breach type.
Stacked area, 2015 to 2025. Total breaches climbed roughly 6x. Hacking and IT incidents went from a thin layer in the mix to dominating the stack outright. Theft, loss, and improper disposal are now rounding errors.
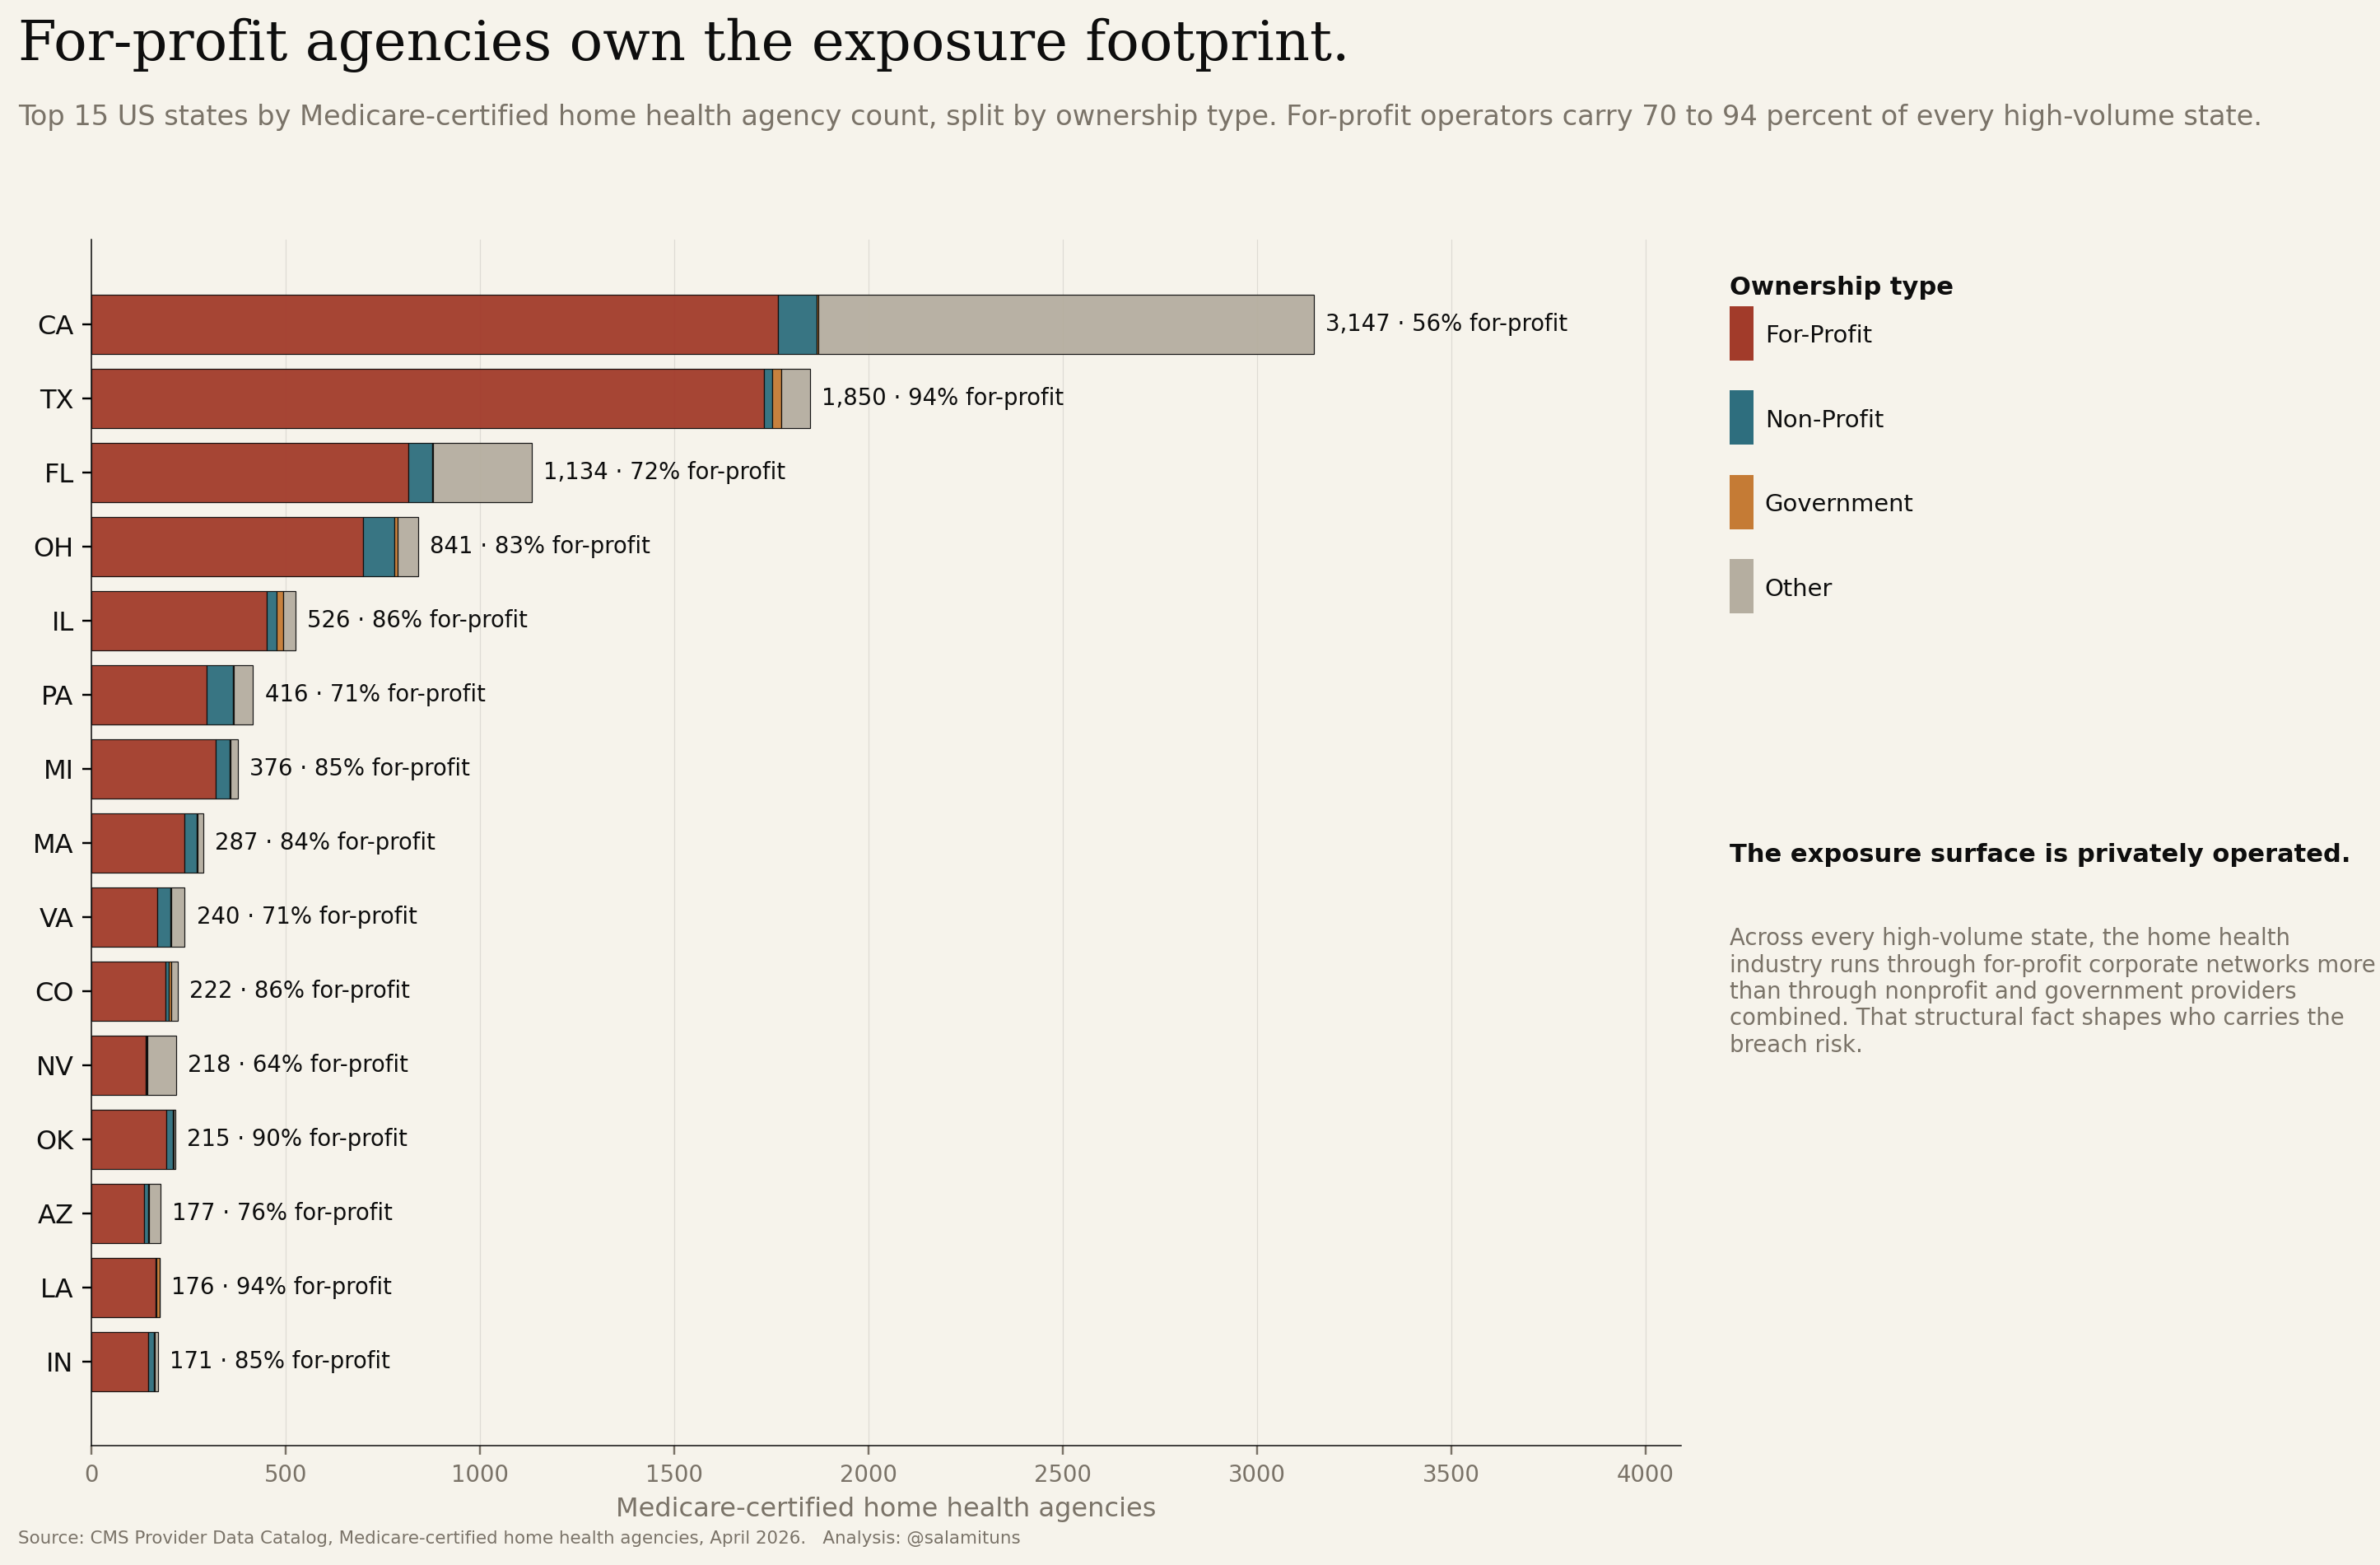
For-profit agencies own the exposure footprint.
Top 15 states by Medicare-certified home health agency count, split by ownership type. For-profit operators run the majority of the network in every high-volume state: 94 percent in Texas, 86 percent in Illinois, 90 percent in Oklahoma. California is the structural outlier at 56 percent for-profit, with an unusually large “Other” classification covering more than a third of its 3,147 agencies.
Where the industry grows, the breaches follow.
Data
- HHS Office for Civil Rights Breach Portal
- HIPAA breaches affecting 500+ individuals, 2015–2026 — archived and under-investigation reports.
- CMS Provider Data Catalog
- Medicare-certified home health agencies, April 2026, with ownership classification.
Method
Breach records from the HHS OCR portal were cleaned, deduplicated, and geocoded to state centroids with a small random jitter for visualization. Agency records from CMS were geocoded from zip codes using the zipcodes package with bundled USPS data. Ownership was classified into For-Profit, Non-Profit, Government, Combination, and Other from the CMS ownership field.
The maps are built with deck.gl — GPU-accelerated WebGL layers — on a CARTO Dark Matter basemap. Data processing is in Python (pandas, zipcodes); static charts are in matplotlib. The full pipeline, intermediate data, and rendering code are on GitHub.
Nothing here is a proxy for causation. What the maps show is co-location and co-density — the spatial argument that breach activity tracks industry growth, visible most clearly in the overlay.