Where US oil data actually lives.
Industry says 99.5% of subsurface data is dark. That number is true and useless, too abstract to act on. This is a basin-by-basin walk through what the US oil and gas industry can actually see of its own history: every drilled well in a state, classified by whether a machine-readable log survived.
One basin at a time. Same method, same palette, same cuts, so the shape of the gap can be compared across geology and century.
Start with the basins.
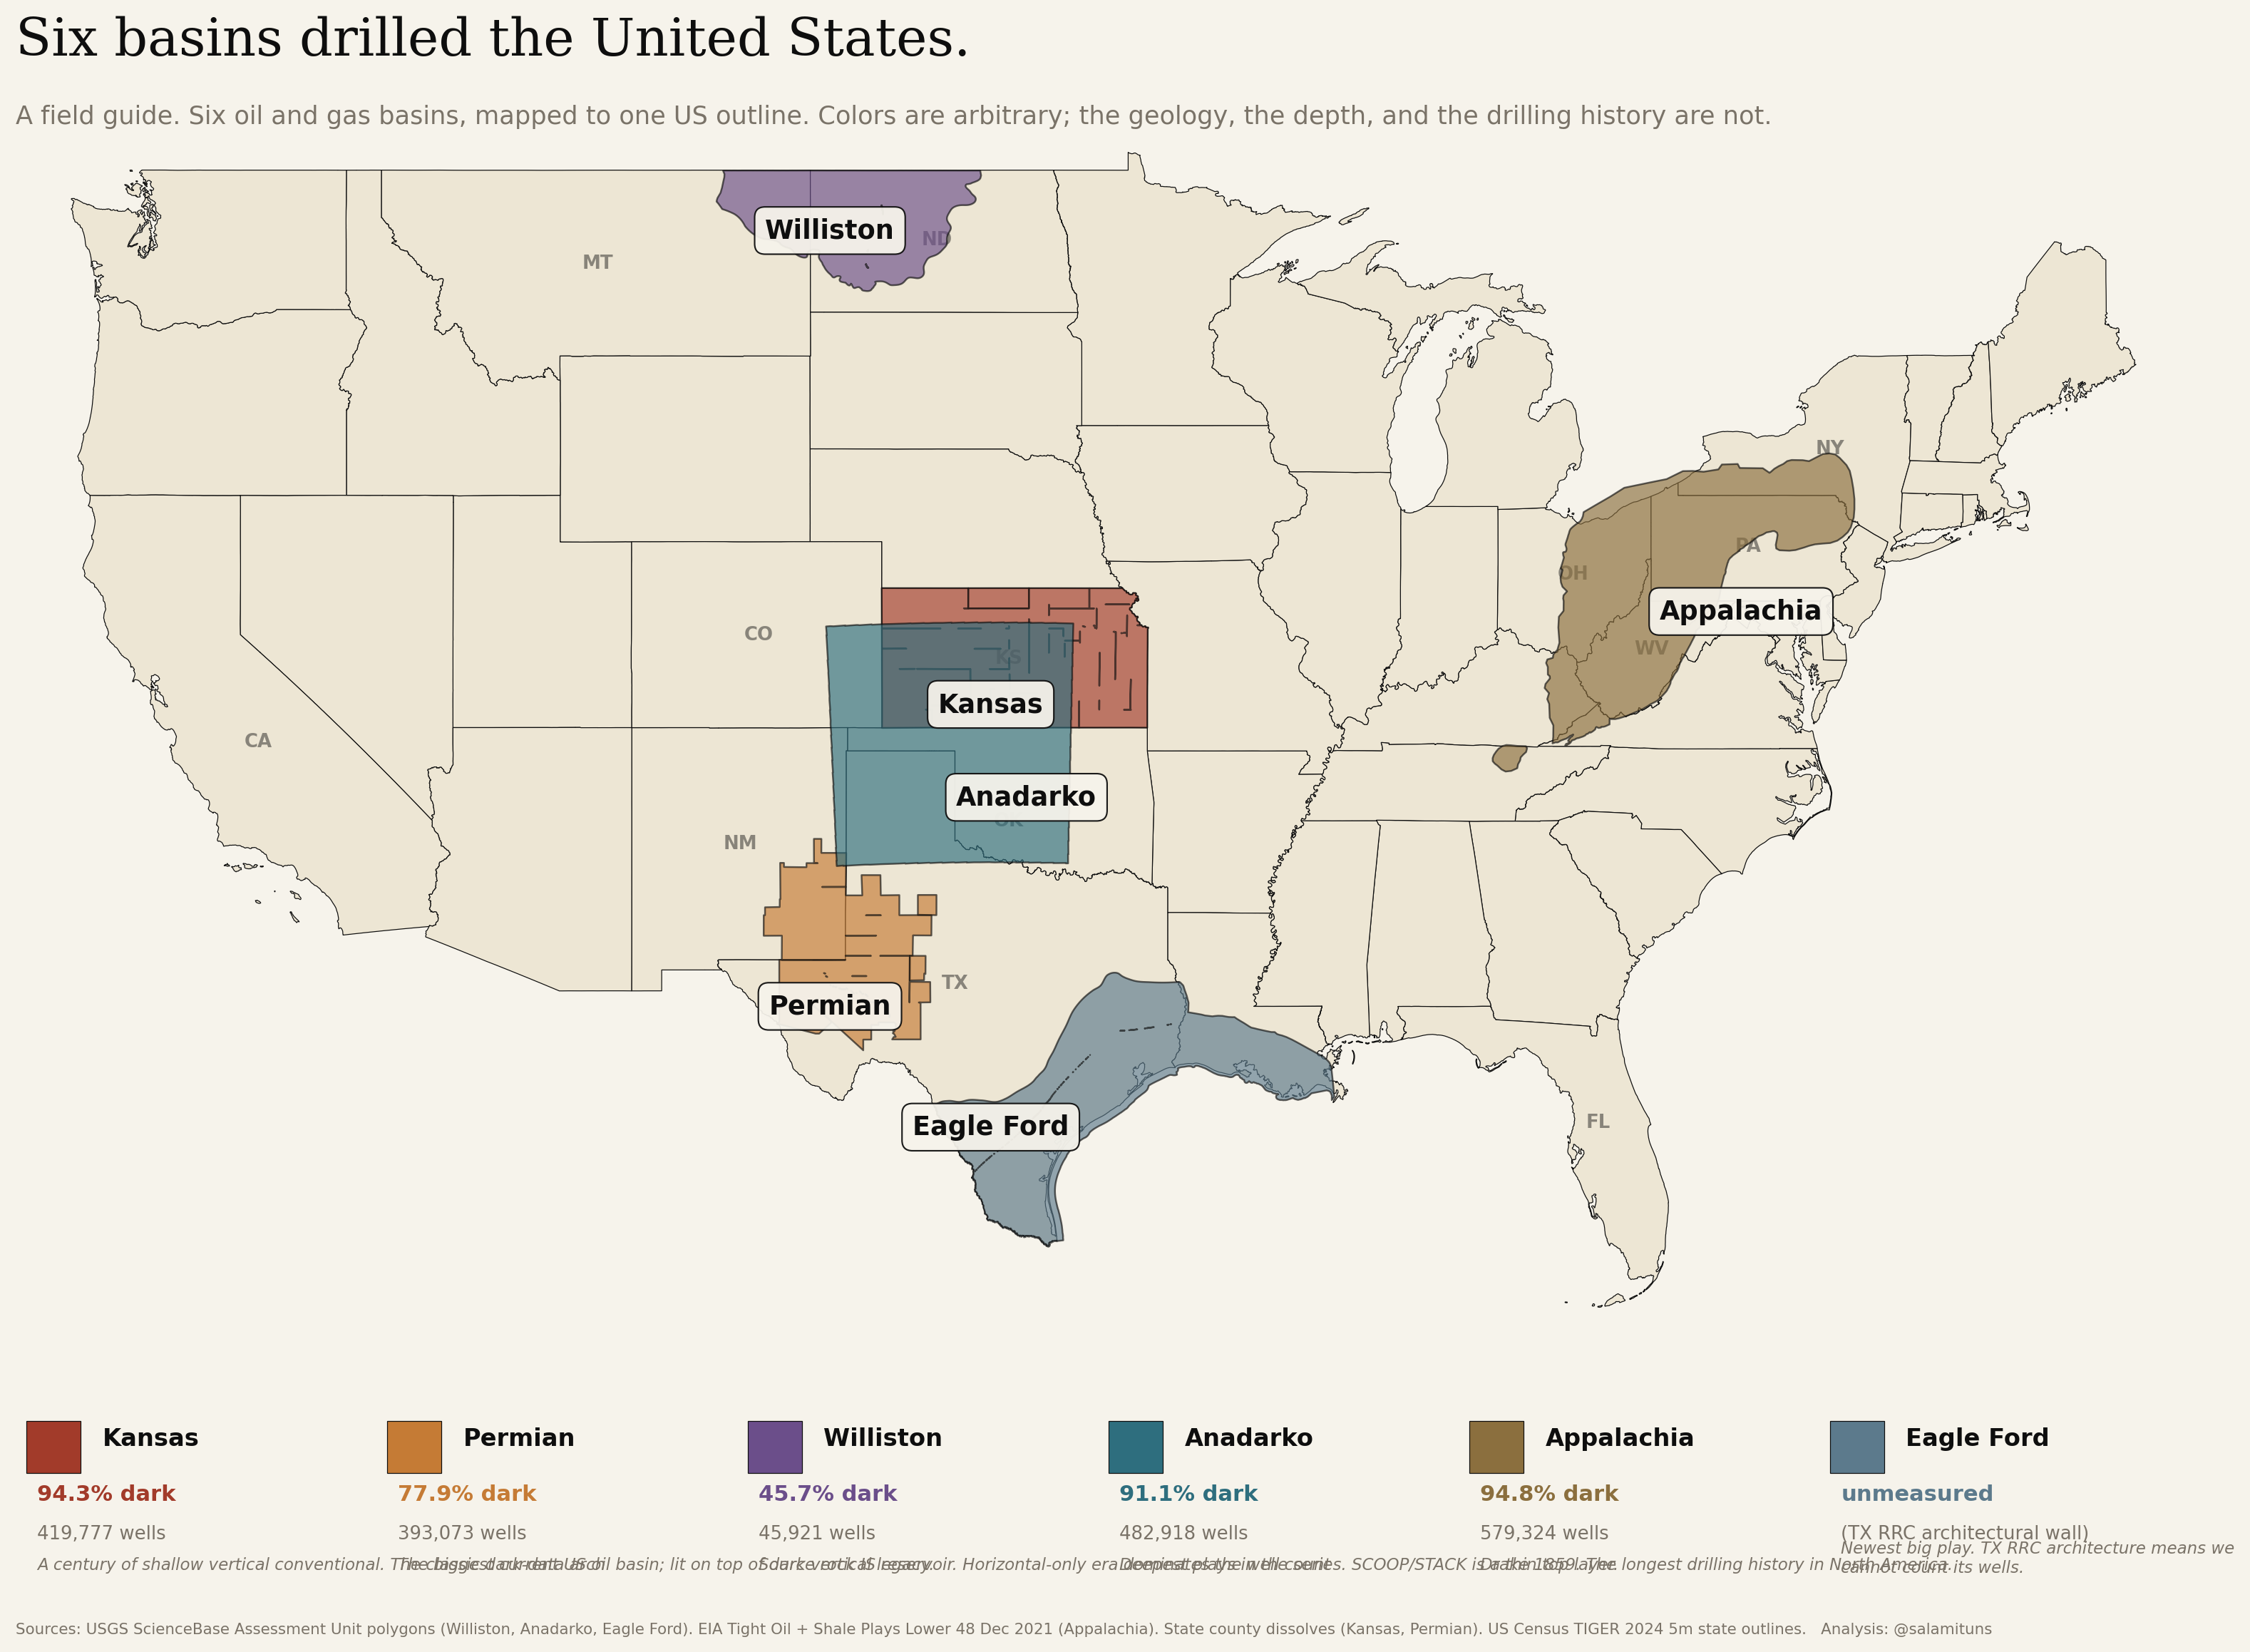
A reader's primer to the six US oil and gas basins covered in this series. Where they are. What rock they target. When they were drilled. Click any basin to inspect, then dive into its full dark-data walk.
Open the primerRunning Totals
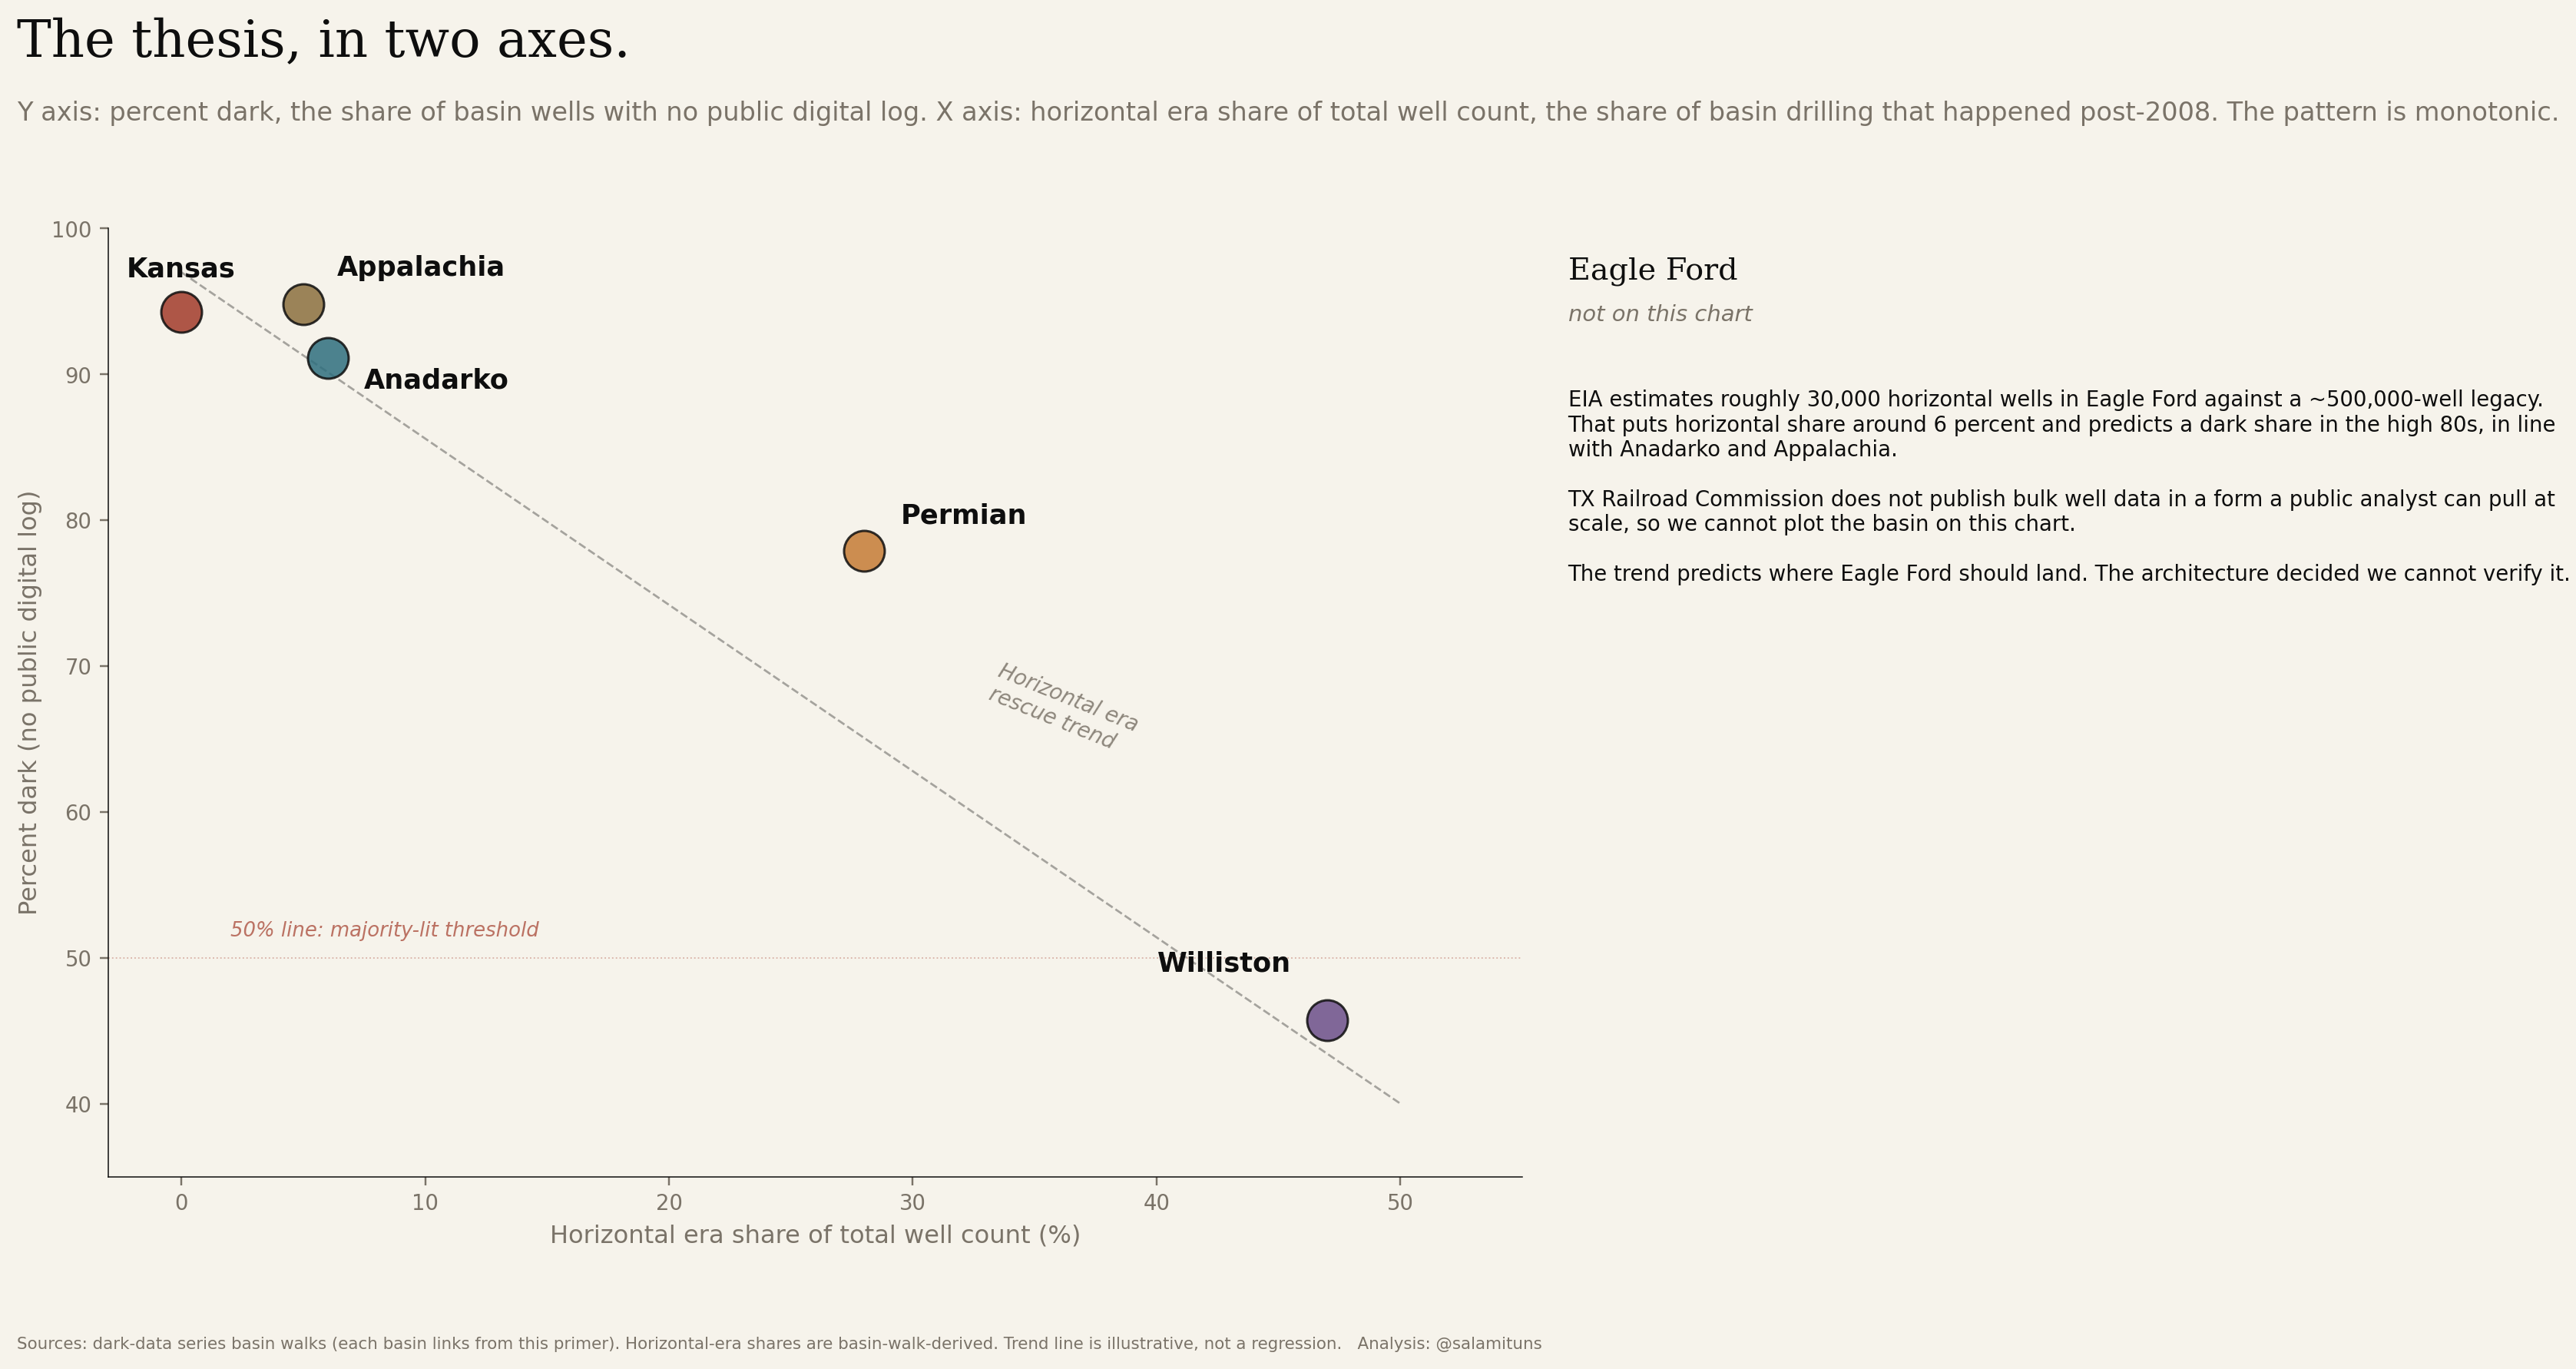
Horizontal eras only rescue young basins.
Five measurable basins, two axes. Y axis: percent dark. X axis: share of the basin's well count drilled in the post-2008 horizontal era. The pattern is monotonic. Williston is the only basin where horizontals dominate the well count, and it is the only basin in the lit majority. Eagle Ford sits off the chart because TX RRC's data architecture would not let us measure it.
The Basins
Kansas, Mid-Continent shelf
419,777 drilled wells. 23,897 with a public LAS. The other 94.3% are dark. A century-wide east–west gradient from the 1920s shallow plays to the 2010s horizontal boom, with 46% of the dark universe sitting under operators that no longer exist.
Permian, West Texas & SE New Mexico
393,073 drilled wells across TX RRC and NM OCD. 22.1% are reachable to a public analyst; the other 77.9% are dark. The lit wells concentrate in the Midland Basin core and Eddy County, the exact footprint of the horizontal Wolfcamp–Bone Spring campaign. 15,601 NM wells belong to PRE-ONGARD, a placeholder for operators that never migrated to the digital era. Dark data is what an industry stops caring about.
Williston, Bakken & Three Forks
45,921 wells clipped to the USGS Bakken & Three Forks TPS polygon across North Dakota and Montana. 54.3% lit, 45.7% dark: the lowest dark share in the series so far. The 2010+ horizontal Bakken carried the basin to the majority-lit side; everything pre-2000 is still paper. The dark share inverts at the state line (ND 43.3%, MT 64.9%) because Montana has no horizontal flag to lean on.
Anadarko, SCOOP/STACK & Hugoton
482,918 wells clipped to the USGS Anadarko Basin Province polygon across Kansas and Oklahoma. 8.9% lit, 91.1% dark: the highest dark share in the series so far. SCOOP and STACK lit a thin south-rim arc (27,396 OK horizontals), but it sits on top of a quarter-million pre-1980 vertical wells in the Hugoton Embayment and the Anadarko Shelf. The Texas Panhandle slice of the basin is excluded; deferred to basin 06.
Appalachia, Marcellus & Utica
579,324 wells clipped to the EIA Appalachian shale envelope across Pennsylvania, West Virginia, and Ohio. 5.2% lit, 94.8% dark: the highest dark share in the series, in the basin Drake spudded in 1859. PA's UNCONVENTI flag captures 23,237 Marcellus horizontals; OH's SLANT field catches 4,670 Utica wells; WV is 100% dark by data architecture (its 2016 well-location file and its 2024 H6A horizontal-production roll do not link). 165 years of vertical legacy overwhelms the modern era.
Eagle Ford, South Texas (finale)
The series finale. 7 USGS Eagle Ford Group Assessment Units across 76 South Texas counties, ~30,000 horizontal wells permitted since 2008, ~500,000 conventional wells of every vintage drilled around them, and zero of them are pullable as a public bulk dataset. TX Railroad Commission ships its bulk well data through a JSF/PrimeFaces session portal backed by EBCDIC mainframe dumps. The architecture itself is the dark-data verdict. This basin ships without per-well data on purpose.
Dark data is a stratigraphy of time. Every basin has a different century missing.
Method: the same four cuts in every basin
01 · The state list
Pull the regulator’s master inventory of drilled oil & gas wells. Every state has one; the field coverage varies.
02 · The log archive
Cross-reference the public LAS/digital-log index. The gap between list and archive is the dark universe for that basin.
03 · The time cut
Classify every well by spud decade. The coverage curve almost always reveals the year LAS became the default.
04 · The operator cut
Join to the current operator-of-record. The orphan share (wells whose last operator no longer exists) is where recovery is hardest.
05 · The play close-up
One zoom per basin, into the biggest concentrated play. Same palette, same cuts. Lets readers compare Cherokee vs Wolfcamp vs Bakken on the same frame.
06 · Open source
Every basin ships with the raw CSV, the notebook, and the map source. If the method stops being the constant, this stops being this project.
Why This Series
Every conversation about AI in the subsurface assumes the training data exists. The maps in this collection ask a slower question first: where does the data actually live, and what shape does the gap take?
If the answer for your basin is “mostly dark, mostly orphaned, mostly pre-1990,” that’s a different product than the one the demos are selling. The series is an honest inventory, basin by basin.